top of page
U.S. Equity Leading Indicators
Investor emotion and random events can drive equity markets in the short term. Longer-term, equity markets tend to be driven by fundamentals and earnings growth. The Quant Pack's U.S. Equity Leading Indicators provide a 12-month S&P 500 earnings forecast and a data-driven fair value estimate for the S&P 500.
-
12-month forecast of year-over-year S&P 500 earnings growth
-
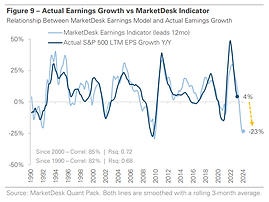
Leading Indicator based on a composite of 15 macro inputs that exhibit a high statistical correlation with future S&P 500 earnings growth.
-
The indicator (1) provides a 12-month view on the direction of earnings and (2) informs portfolio positioning across sectors and asset classes.
S&P 500 Earnings Leading Indicator
Leads Actual Results by 12 Months
-
Real-time price target model for the S&P 500
-
Two fair value frameworks: (1) equity risk premium and (2) cost of capital analysis.
-
The price target model (1) provides a fair value estimate for the S&P 500, (2) calculates the implied level of upside or downside from current levels, and (3) informs stock and bond asset allocation decisions.
S&P 500 Real-Time Price Target Indicator
Implied Upside/Downside from Current Levels


bottom of page